
Measurement was only the first step
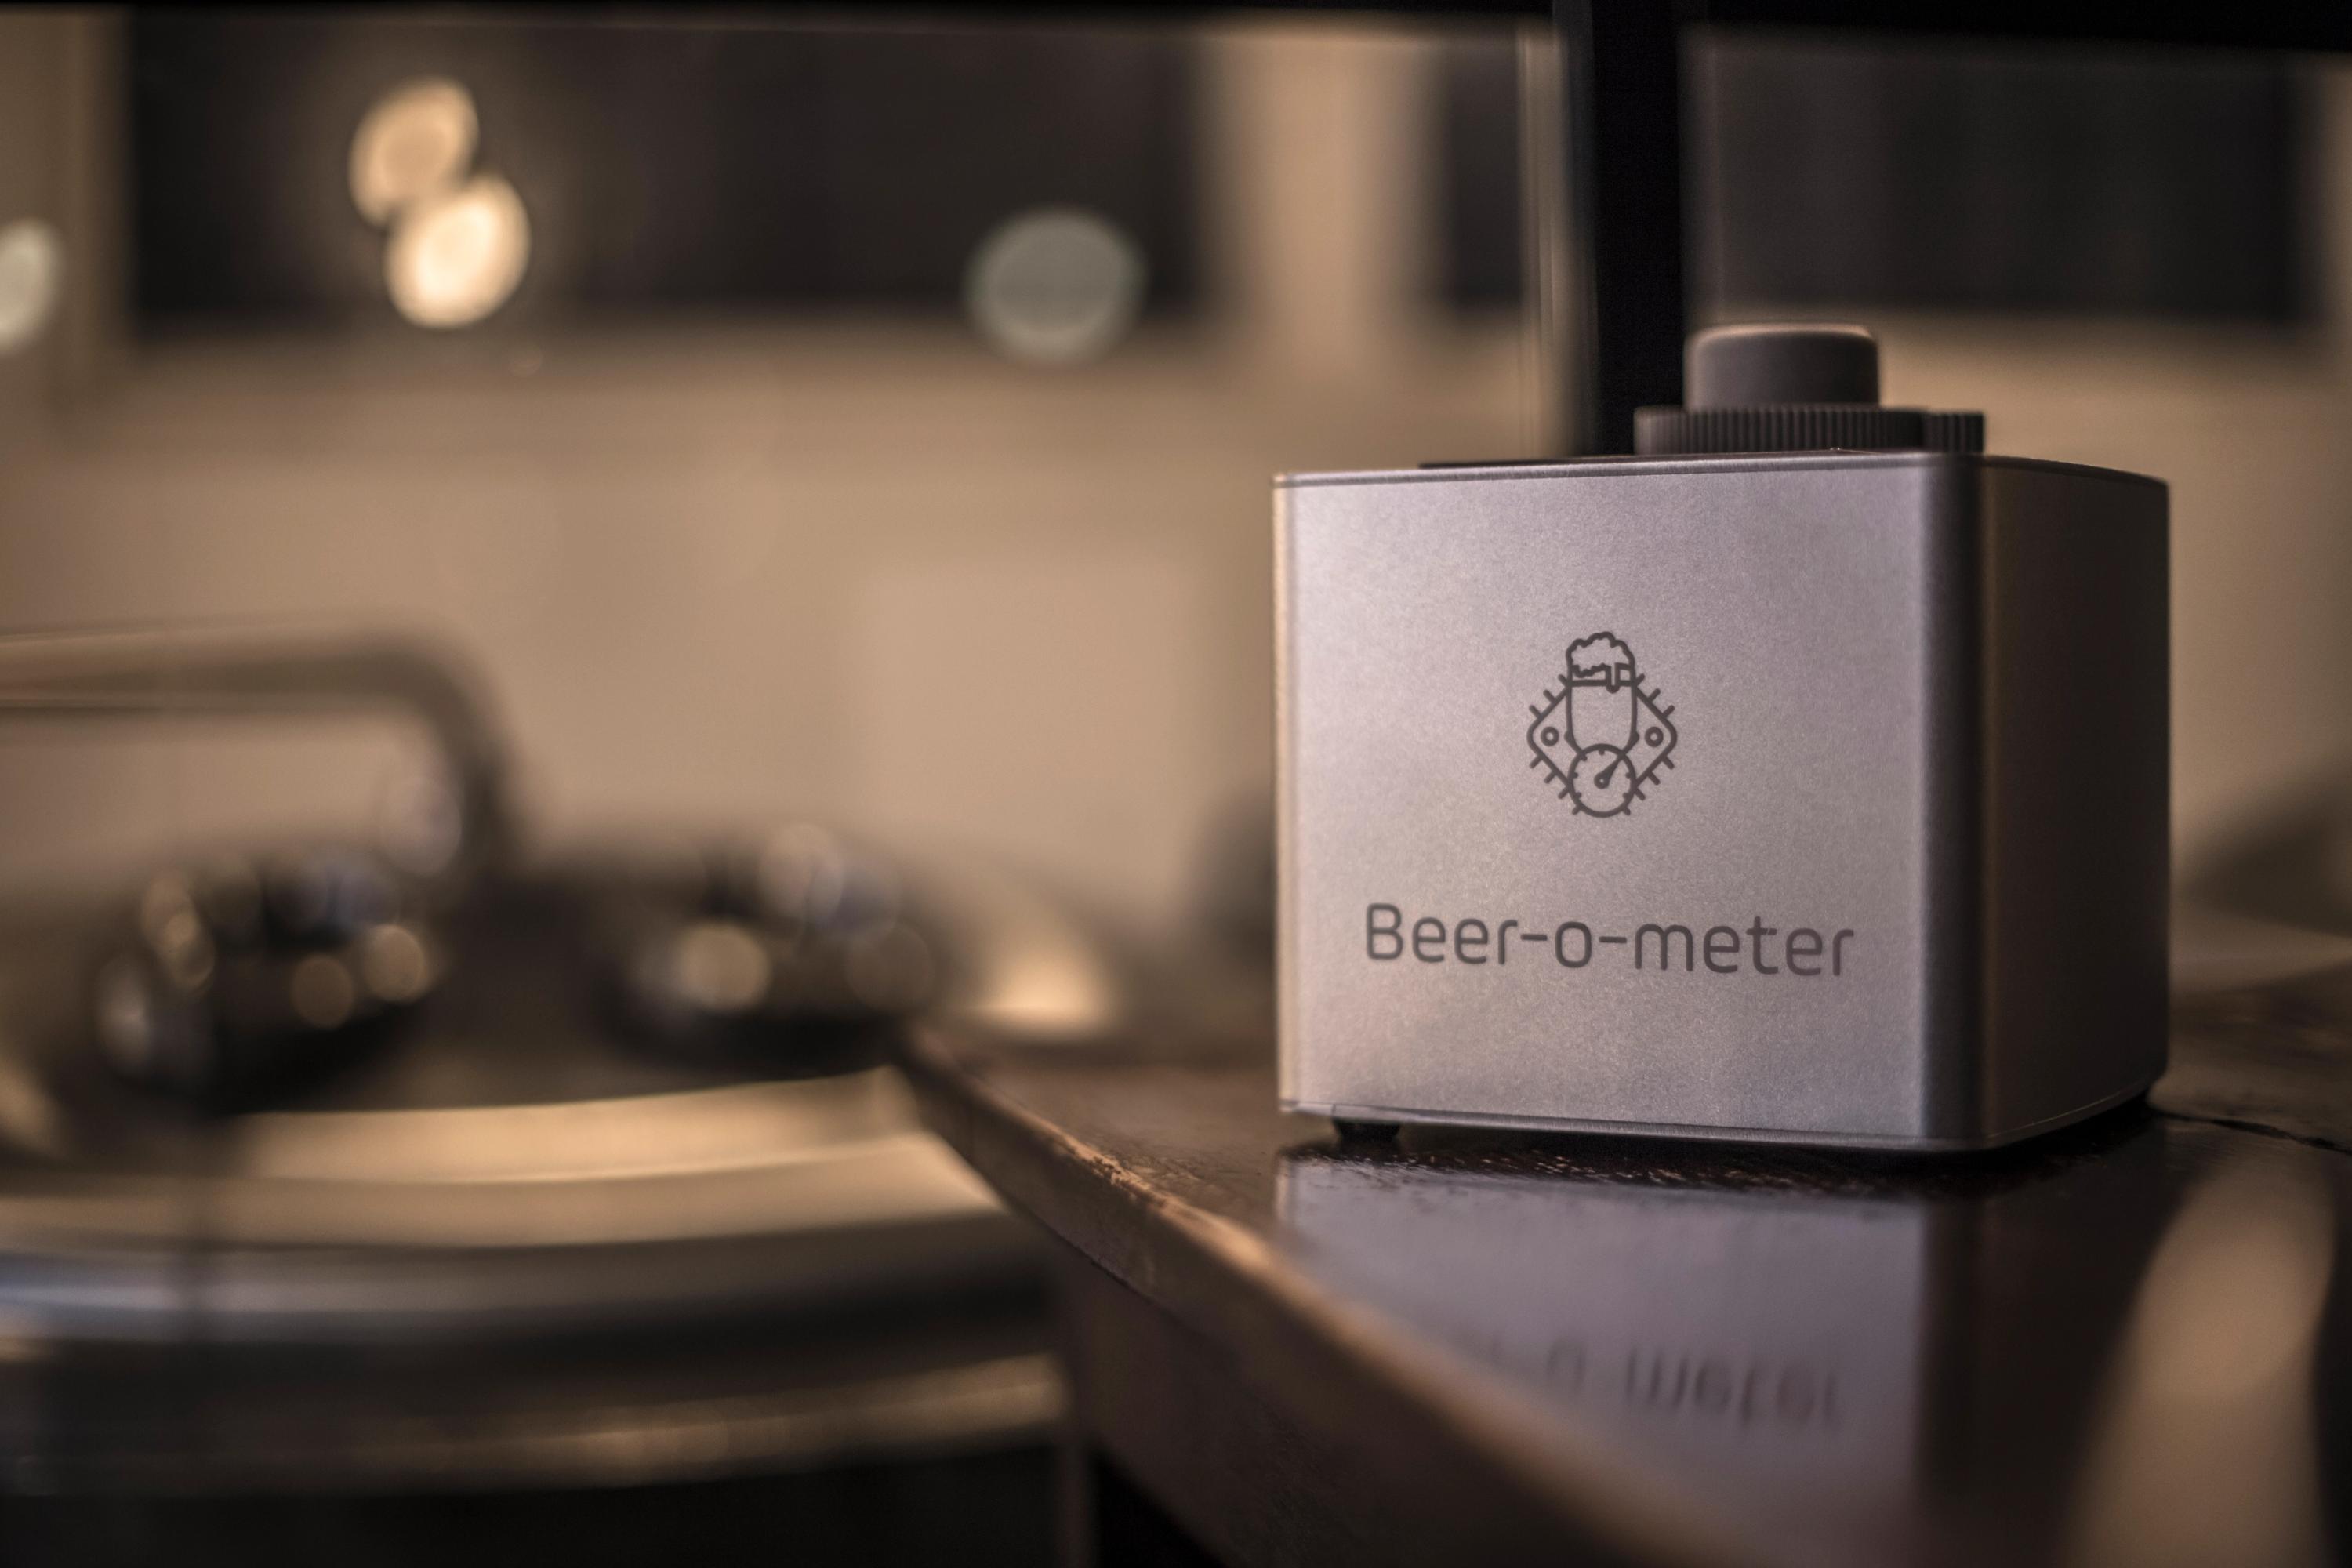
When we started developing Beer-o-Meter, the idea was relatively simple. We wanted to make useful laboratory information available directly inside a brewery. Instead of sending every sample to an external laboratory or investing in expensive analytical equipment, breweries should be able to measure important process parameters themselves.
Fermentable sugars became one of the central parts of this approach because fermentation is fundamentally a process of sugar conversion. Brewers prepare a wort containing carbohydrates, introduce yeast and then follow how fermentation develops. Despite this, fermentable sugars themselves are rarely measured routinely in small and medium-sized breweries (even in some big ones).
Giving brewers access to this information was an important first step, but working with breweries showed us something else. A brewer needs to understand what the number means in the context of the process.
A result only becomes useful in context
If the Beer-o-Meter shows 8 g/L of fermentable sugars, the immediate question is not whether the instrument displayed the number correctly. The useful questions are whether 8 g/L is normal for this beer at this stage of fermentation, whether the concentration is still decreasing, whether it is different from previous batches, and whether the beer is ready for the next production step.
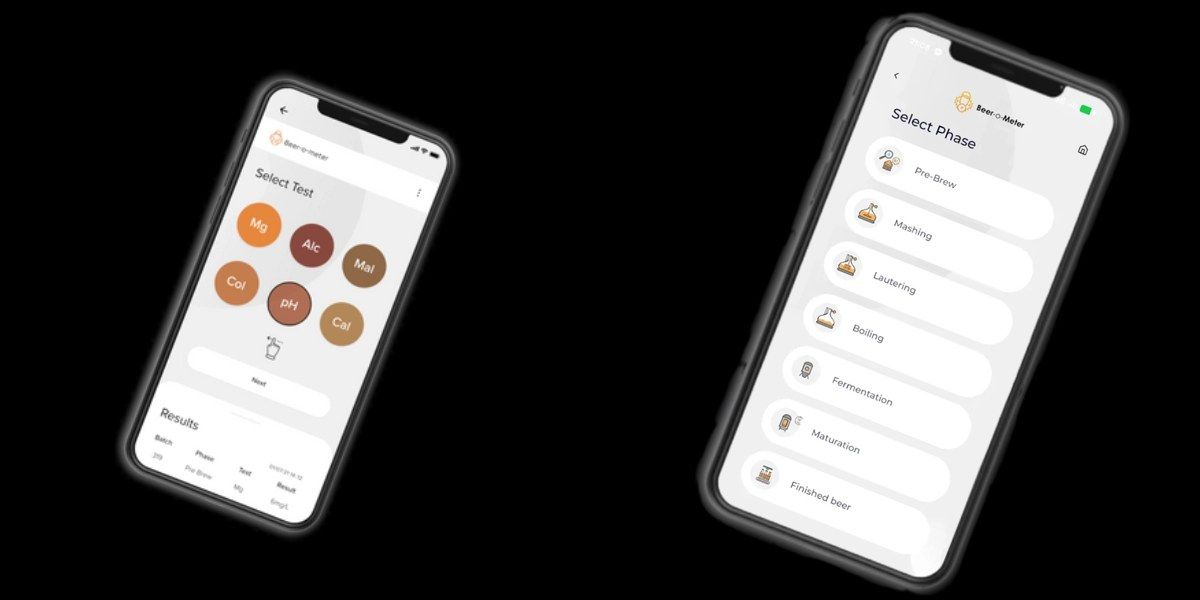
These questions are shaping the next stage of our development. We are continuing to develop new analytical tests, but at the same time we are building software that can transform measurements into process information.
The goal is to move Beer-o-Meter from a system that measures samples towards a system that helps breweries follow, compare and understand fermentation.
Fermentation has nice curves
One of the most important changes is to look at fermentation as a curve rather than as a final number. In many breweries, fermentation records are still built mainly around starting gravity, several measurements during fermentation and a final gravity. These measurements are useful, but they show only part of what is happening.
Imagine two batches of the same beer that eventually reach the same final gravity. In the first batch, yeast consumes most of the fermentable sugars during the first three days and then slowly approaches a stable endpoint. In the second batch, fermentation starts slowly, accelerates later and still contains much more fermentable material on the day when the brewery normally expects fermentation to be complete.
If we only compare the final gravity, the two batches may look similar. From a process-control perspective, however, they behaved very differently. The second fermentation may indicate problems with yeast health, oxygenation, pitching rate, temperature control or wort composition.
By following fermentable sugars throughout the process, it becomes possible to see not only where the beer finishes but also how it gets there.
Building a complete fermentation history
We therefore want the software to create a complete fermentation history. Fermentable sugars, pH, gravity, temperature and other available measurements can be placed on the same timeline together with production events such as dry hopping, cooling, transfers or changes in pressure.
This context makes individual measurements much more useful. An increase in fermentable sugars becomes easier to interpret when the brewer can see that it occurred directly after dry hopping. A slow reduction in sugars becomes more meaningful when it can be compared with the fermentation temperature or with previous batches of the same recipe.
Comparing one batch with another
Another important part of the system will be batch comparison. Experienced brewers often notice that a fermentation is behaving differently before they can clearly explain why. They may say that a particular beer normally finishes in five days, that fermentation normally accelerates after the first twenty-four hours, or that the gravity normally falls much faster after day two.
This knowledge already exists in breweries, but much of it remains in the brewer’s memory rather than being captured in a system. We want to make these comparisons visible.
If a brewery has produced the same IPA ten times, it should be possible to compare the fermentation profiles of those ten batches directly. This could quickly show whether the starting fermentable sugar concentration was different, whether yeast activity started later, whether attenuation slowed unusually early, or whether the response to dry hopping changed.
Historical data can then become useful for the next brew instead of disappearing once the batch has been packaged.
Bringing fermentable sugars into recipe development
We are also thinking about recipes differently. Brewing software traditionally describes recipes using ingredients and process settings. Malt, hops, yeast, water, mash temperatures, bitterness, colour, original gravity and final gravity are all commonly recorded.
We believe that fermentable sugar information should become part of this description as well.
A brewery could, for example, define an expected range of fermentable sugars after wort preparation. The actual wort could then be compared with that target. Later, the fermentation curve could be compared with previous batches. Before packaging, residual fermentable sugars could be checked against the normal range for that specific beer.
This creates a connection between recipe design, wort preparation, fermentation behaviour and final beer stability.
Detecting unfinished fermentation earlier
This approach can become especially useful when fermentation does not proceed as expected. Low yeast vitality, insufficient oxygenation, incorrect pitching rate, temperature problems or pressure can all influence sugar consumption. In these situations, a beer may reach a relatively stable gravity while still containing more fermentable carbohydrates than expected.
This does not automatically mean that the beer is unsafe or that fermentation must continue. It means the brewer should know that the batch is behaving differently before deciding what to do next.
In the future, we want the software to make these differences very clear. Instead of simply showing a graph, it could tell the brewer that previous batches normally contained 3-4 g/L of fermentable sugars at this stage while the current batch contains 8 g/L.
The brewer still makes the decision, but the software provides the context needed to make that decision with more confidence.
Dry hopping is one of the strongest use cases
Dry-hopped beers are one of the strongest reasons for developing the system in this direction. As we described in our work on hop creep, adding hops can increase fermentable sugars because hop enzymes break larger carbohydrates into compounds the yeast can use. If the yeast remains active, those sugars are then consumed again.
The resulting fermentation profile can therefore move in both directions. Fermentable sugars appear and are then removed. A single measurement may miss this process, while a complete timeline can show it very clearly.
For dry-hopped beers, we want the system to separate measurements before and after the hop addition and help the brewer see whether additional fermentable material has appeared, whether yeast is consuming it and whether the beer eventually reaches a stable condition before packaging.
Better control of refermentation risk
This is particularly important for beers that are refermented in bottle or can. Residual fermentable sugars are sometimes intentional because they contribute to conditioning. However, uncontrolled additional fermentation can lead to excessive carbonation, changes in flavour and, in extreme cases, excessive package pressure.
Better information before packaging can therefore reduce both quality risks and product losses.
New tests with a clear purpose
At the same time, we are continuing to expand the analytical side of the Beer-o-Meter. Total fermentable sugars remain very useful because they give a practical answer to an important production question. However, in some cases it is useful to know more about the composition behind that number.
We are therefore preparing additional tests for individual fermentation-relevant sugars and other parameters that can help explain what happens during wort preparation and fermentation.
The goal is not to turn every craft brewery into an analytical laboratory. We want to identify a relatively small number of measurements that provide the most useful information for everyday brewing decisions.
For us, every measurement should have a reason. If a result does not help a brewer understand the process or decide what to do next, we should question whether it needs to be measured routinely.

From quality control to accumulated process knowledge
Our longer-term goal goes beyond quality control. Every fermentation generates valuable information about raw materials, yeast, equipment and process conditions. In many breweries, much of this information is lost once the beer is packaged.
We want to turn those individual measurements into accumulated process knowledge. After twenty batches, the system should know much more about how a particular beer normally behaves than it did after the first batch. It should become easier to recognise abnormal fermentation early, understand whether a recipe change improved consistency, and see how different dry-hop procedures affect the final beer.
We do not believe that craft brewing should become completely automated. Brewing depends on creativity, sensory judgement, experience and decisions made by people. Technology should support that process rather than replace it.
This is the direction we are taking with Beer-o-Meter: from measuring one sample to following a fermentation, from following one fermentation to comparing batches, and from comparing batches to understanding the process behind them.
The objective is not more data for the sake of data. It is better information that helps breweries produce beer that is more stable, more reproducible and easier to understand.